✨ SoifGo Effects Tutorial
Effects turn your buttons into live visual indicators. When a numeric value arrives — from Bluetooth, MQTT, API, sensors, or the built-in simulator — the button reacts in real time. This guide covers all available effects: Size, Circle, Move, Rotate, Color, Graph, Formula, and ALARM.
🎮 Simulation Setup
If the required hardware for applying values by address to test button actions is unavailable,
you can enable the simulator. It provides an internal counter ranging from 1 to
1024, allowing you to prototype and test your button behavior.
The input can also have negative values. When setting the maximum input value, click on the label and also enter the negative input value. For example, if your input is between -20 and 100, set the maximum positive input value to 100 and the maximum negative input value to 20.
How to Use
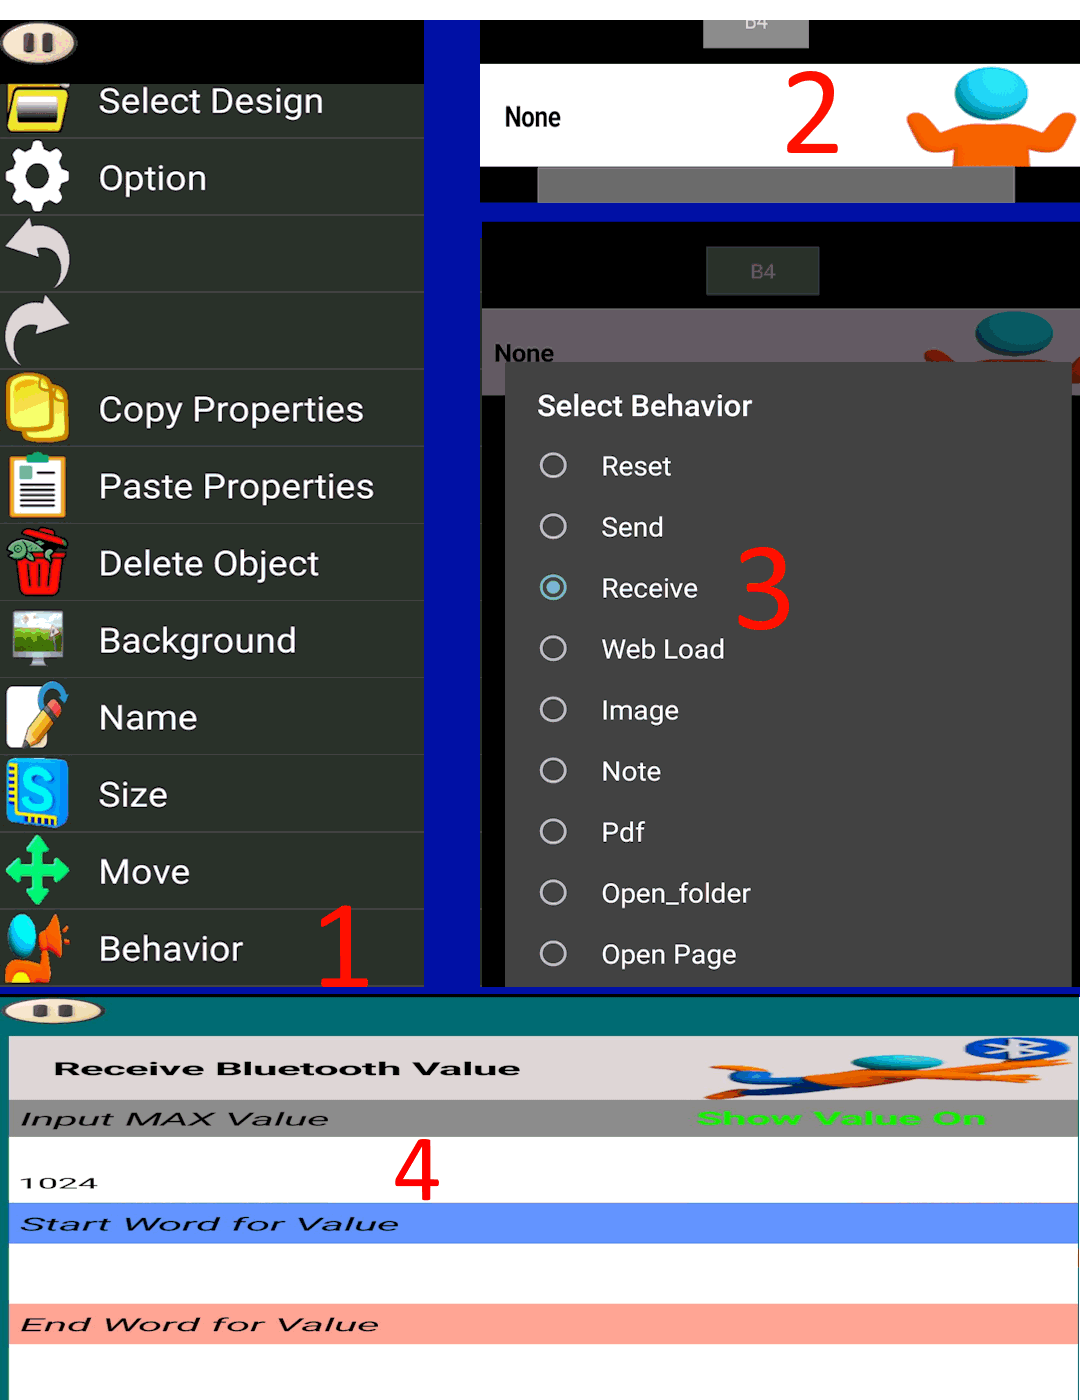
- Set the button behavior to numeric input (Bluetooth, API, or MQTT).
- Set maximum input value to
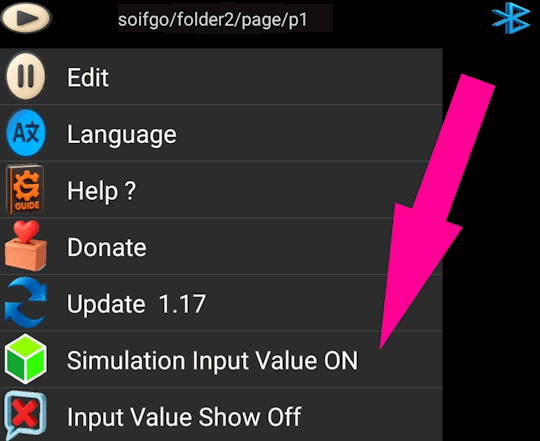
1024. - Enable Simulation Input Value from the Play menu.
- The simulator will apply values from
1to1024automatically. - Once testing is complete, configure the external hardware address as needed.
⚙️ Setup
- Create the button: Set behavior to numeric input (Bluetooth, API, or MQTT).
- Maximum:
1024. - Enable simulator: Use simulation input value in Play to generate values
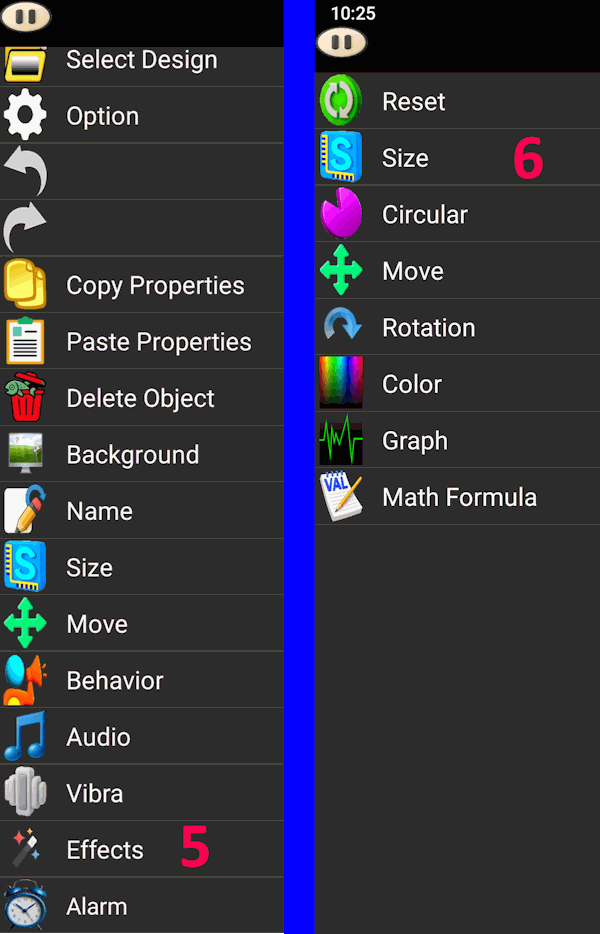
1 → 1024. - Edit mode: Click the button and open Effects. Options include Size, Circle, Move, Rotate, Color, Graph, Formula, and ALARM. In the app menu the same effects may be labeled Circular, Rotation, Math Formula and Alarm.
📏 Size
Two sliders appear: the upper slider sets width to the far right; the next slider sets height to the top. For maximum variation,
place the button at the leftmost and lowest position. In the Play screen, when a numeric value is received — whether via Bluetooth,
simulator, API, MQTT, or internal sensors — the button's size begins to change from its initial state toward the configured maximum,
in proportion to that value (up to 1024).
This effect can be used in applications such as vertical or horizontal balancers, temperature indicators, tank fill-level displays, and similar cases.
Suitable for balancing visuals like rising water or fuel level, or any growing variable.
⭕ Circle
Renders a circular chart (full or partial) behind the button. Set start and end degrees for the minimum and maximum input. Adjust the button's background for visibility. Ideal for showing input power, throttle, and similar gauges.
↔️ Move
Moves the button to the far right and to the top based on input. Two sliders control motion: the first for horizontal (right), the second for vertical (up). Useful for building thermometers, balancers, scales, tank level, and similar indicators.
🔄 Rotate
Rotates the button up to 360° for maximum input. The first slider sets the start position for input 0;
the second sets the end rotation at maximum input. If you are using a needle in the button background and cannot reach a specific
position, adjust the initial needle/background rotation after setting the background to achieve the target angle.
Suitable for clocks, pressure/temperature/current/voltage gauges, speedometers, and more.
🎨 Color
Choose a preset from the Select Effect list: Battery, Cooling, Light W (white / brightness), Light R, Light G, Light B and Light Y (red, green, blue, yellow), or None. Each preset sets the button color for the minimum and maximum input—for example, Battery visualizes depletion, and the Light presets increase the intensity of their color from minimum to maximum input.
🎬 Effects Demo
📈 Graph
Draws a line graph of the input on the button. In the settings, select the graph line color and thickness. Drawing is always
time-based: the graph is drawn at the interval you set. At the bottom, two sliders are available: the first sets the drawing
interval from 100 ms to 60 s; the second controls the graph line thickness.
A button at the bottom of the settings shows the save mode and opens a Select Effect list:
- Save Page: each graph page is saved as a text file in the SoifGo/graph folder. The file name contains the button name and the date. Saved graphs can be shared or transferred.
- None : Save Page: nothing is saved in the graph folder.
In Play, the graph is drawn on the button at any button size (a larger button is easier to read). Tap the button to open the graph panel (Run, Stop, View, Graph Select), where you can zoom and navigate history pages.
If you want to create another graph or a new group using the same button, simply change the button name in the Edit section. With the new name, fresh graphs will be recorded. To revisit a previous graph, rename the button back to its former name. Don't worry if you forget—saved graphs are stored under their names in the SoifGo/graph folder. Use your file manager to browse and access them anytime.
Graph Demo
🧮 Formula
This feature displays a custom value derived from the input. For example, if input range is 0–1024 but you want
0–512, write val/2. The input variable name is val. Formula authoring uses HTML-like
functions.
Available Math Functions with Examples
| Function | Description | Example |
|---|---|---|
+ | Adds two numbers | val+10 → if val=5 → 15 |
- | Subtracts second number from first | val-2 → if val=7 → 5 |
* | Multiplies two numbers | val*3 → if val=4 → 12 |
/ | Divides first number by second | val/2 → if val=10 → 5 |
% | Remainder of division | val%3 → if val=10 → 1 |
Math.pow | Exponentiation | Math.pow(val,2) → if val=4 → 16 |
Math.sqrt | Square root | Math.sqrt(val) → if val=9 → 3 |
Math.cbrt | Cube root | Math.cbrt(val) → if val=8 → 2 |
Math.round | Rounds to nearest integer | Math.round(3.6) → 4 |
Math.floor | Rounds down | Math.floor(3.9) → 3 |
Math.ceil | Rounds up | Math.ceil(3.1) → 4 |
Math.trunc | Removes decimal part | Math.trunc(5.7) → 5 |
Math.fround | Rounds to 32-bit float | Math.fround(1.337) → 1.337000012 |
Math.abs | Absolute value | Math.abs(-7) → 7 |
Math.sign | Sign of number | Math.sign(-5) → -1 |
Math.random | Random number 0–1 | Math.random() → e.g. 0.42 |
Math.PI | Pi constant | Math.PI → 3.14159… |
Math.E | Euler's number | Math.E → 2.718… |
Math.sin | Sine of angle | Math.sin(Math.PI/2) → 1 |
Math.cos | Cosine of angle | Math.cos(0) → 1 |
Math.tan | Tangent of angle | Math.tan(Math.PI/4) → 1 |
Math.log | Natural log | Math.log(Math.E) → 1 |
Math.exp | e^x | Math.exp(1) → 2.718… |
Math.hypot | Hypotenuse length | Math.hypot(3,4) → 5 |
Math.max | Maximum | Math.max(1,9,3) → 9 |
Math.min | Minimum | Math.min(1,9,3) → 1 |
Math.clz32 | Leading zeros in 32-bit | Math.clz32(1) → 31 |
toRadians | Degrees → radians | toRadians(180) → 3.14159… |
toDegrees | Radians → degrees | toDegrees(Math.PI) → 180 |
🚨 ALARM
The alarm provides both text and sound notifications. It is triggered when the measured value becomes greater or less than the configured threshold.
- Alarm Set: A bar shows the condition and the threshold (for example
Alarm > 23). Tap the bar to choose "greater than" or "less than"; the input below it holds the threshold value. - Alarm Text: The text notification displayed when the alarm is triggered.
- Delay Setting: A configurable delay bar is available at the bottom to manage consecutive alarms.
- Sound Notification: The alarm sound uses the same configuration as the button sound setting.