
AnyScan209 – Free 2D/3D Universal Visualizer & Magnetometer App for Android
AnyScan209 is a professional free Android app that transforms your smartphone into a powerful 4-in-1 sensor visualizer for any sensor data in the 0–1024 range.
Designed for geophysical surveys, magnetic field visualization, subsurface anomaly detection, elevation mapping, illumination analysis, and acoustic noise mapping, this app supports both internal smartphone sensors and external Bluetooth modules like HC-05.
With AnyScan209, you can perform 2D and 3D mapping, export data in OBJ, STL, and CSV formats, and analyze variations with precision. Whether you're a researcher, educator, or hobbyist, this free universal visualizer provides professional-grade analysis tools right on your Android device.

1. How to Create a Scan File in AnyScan209
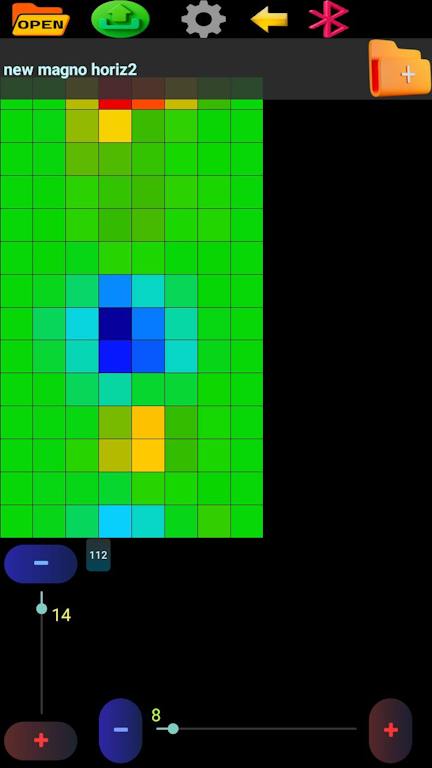
The AnyScan209 features three main screens. To create a scan file, select the required dimensions using the longitudinal and transverse bars. The supported scan size range is from 8×8 up to 100×100 points, allowing detailed mapping and data visualization.
Enter a file name if required and select the Create Scan option. The top menu includes Open Scan, Export (OBJ, STL, CSV), and Bluetooth transfer options. Long-press the Bluetooth icon to adjust communication speed for external sensors. Use Settings to configure sensors, language, and device connection.
2. Scan Screen Operations and Data Recording
Use the phone back button or the top navigation arrow to enter the scan screen. The menu provides New Scan, 2D/3D mode selection, and scanning direction options for flexible data collection.
The navigation controls allow movement through grid cells without recording. Press Record to save measurements. Long-press the Record button to enable automatic timed recording – perfect for systematic surveys.
After completing a scan, choose Direct Save for original data or Enhanced Save for improved visualization processing.
3. Data Management – Save, Restore, and Edit Cells
Manual Save & Rollback
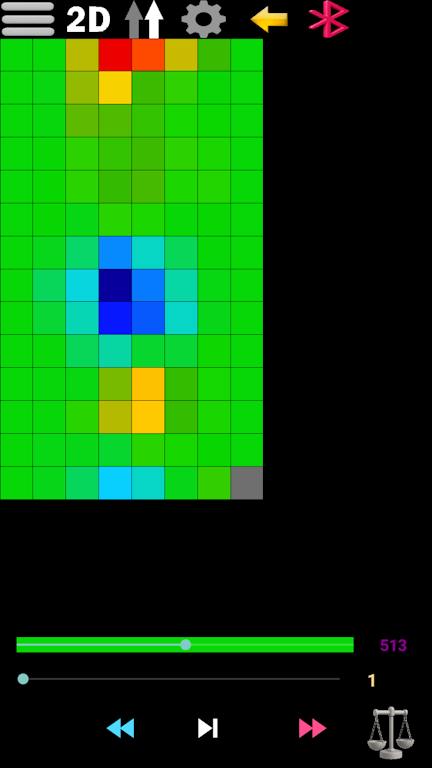
You can save your scan at any point during data collection using the Save option from the menu. If you make a mistake, simply cancel the save – the app will roll back to the last saved state.
Using the navigation buttons (back/forward), you can jump to any cell and continue scanning from that point.
Editing Individual Cells
You can edit any single cell manually, but only in External mode or when Bluetooth is disconnected.
- Adjust the slider at the bottom to set a custom value between 0 and 1024.
- Press the Record (▶) button to write that value into the currently selected cell.
4. Scan Direction and Navigation
The scan always starts from the bottom‑right corner and moves vertically (bottom to top).
Two scan modes are available:
- One‑Way (Go/Go): Scan bottom→top, then return to the bottom and start the next column.
- Zigzag (Go/Return): Scan bottom→top, then continue directly top→bottom in the next column. This is faster and more efficient for large grids.
Use the direction toggle in the scan menu to switch between these modes.
5. 2D Visualization Features
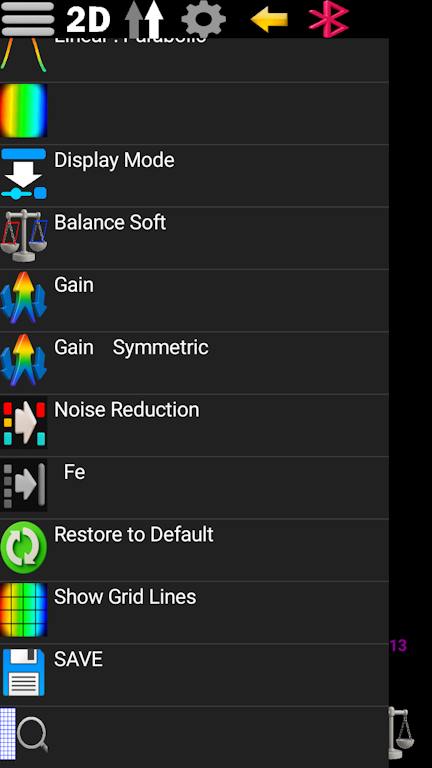
The 2D menu provides different visualization tools including:
- Smoothing – reduce noise in your data
- 43 color palettes – customize visual representation
- Amplification modes – enhance subtle variations
- Noise reduction – improve signal clarity
- Grid display – precise spatial reference
- Zoom functions – detailed analysis of specific areas
- RGB channel removal – cancel any color channel
- Color shift – rotate the color spectrum
- Crop – focus on specific regions
6. 3D View and Advanced Visualization Settings
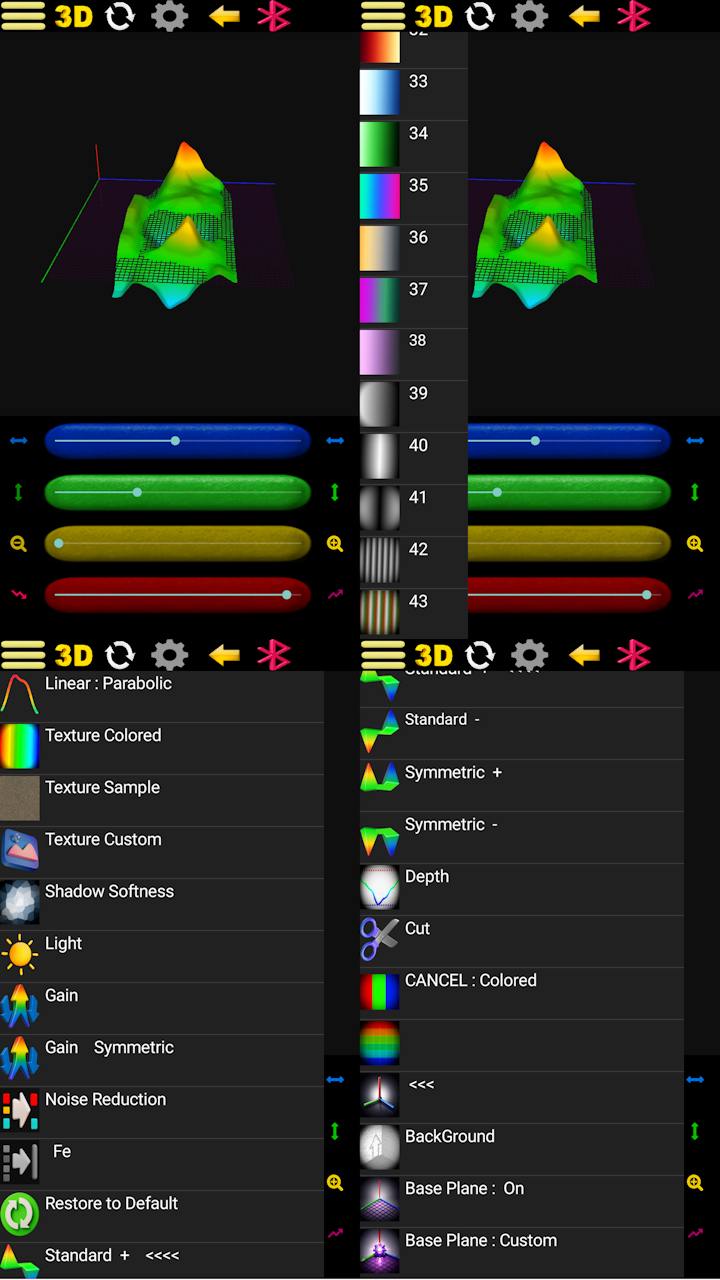
The 3D viewer allows:
- Rotation – examine data from any angle
- Movement – navigate through the 3D space
- Depth adjustment – focus on specific layers
- Lighting control – enhance visual clarity
- Custom textures – apply your own images as surface textures
- 43 color palettes plus texture options
- RGB channel removal – cancel any color channel
- Amplify height – exaggerate vertical differences
- Amplify colors – boost overall vibrancy
- Color shift – rotate the color spectrum
- Crop – focus on specific regions
Long-press the rotation control to enable automatic rotation for dynamic presentations. The viewer supports different presentation modes for easier interpretation of collected data.
7. Export and Data Transmission Formats
AnyScan209 supports data export and real-time streaming in multiple formats for maximum compatibility with analysis software:
- OBJ: Best for advanced 3D modeling and rendering software.
- STL: Ideal for 3D printing applications to generate physical topographic relief maps.
- CSV: Standard spreadsheet formatting used for tabular data analysis in Microsoft Excel, MATLAB, or Voxler.
- Real-Time Bluetooth Serial Stream: Allows a 1:1 raw data broadcast directly to compatible receivers, such as customized Microsoft Office macros, analytical HTML scripts, or third-party mapping applications with built-in serial communication capabilities.
8. General Settings and Sensor Configuration
The settings menu provides:
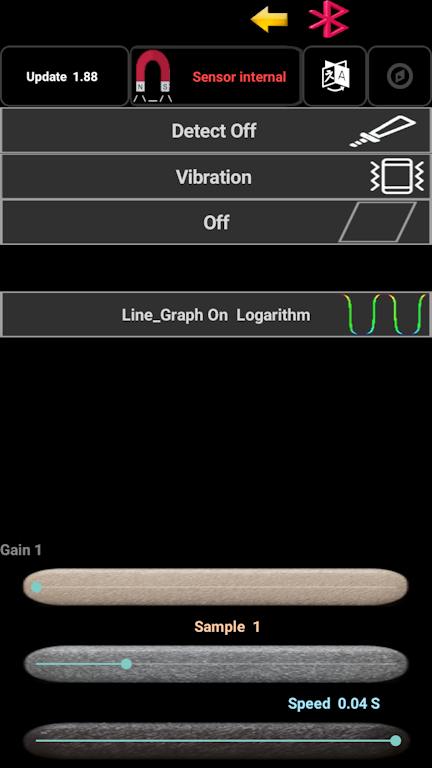
- Sensor selection – internal or external (Bluetooth)
- Language selection – English or Persian
- Compass options – for orientation assistance
- Detector sound – audio feedback for measurements
- Vibration feedback – tactile confirmation
- Screen control – power management during long scans
- Visualization assistance tools – for improved data interpretation
The app supports internal smartphone sensors and external Bluetooth sensor modules like HC-05 and other SPP-compatible devices.
9. Pro Tip: Enhancing Your Scanning Setup
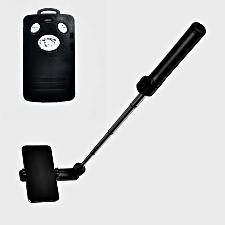
For stable scanning movement, a smartphone holder or selfie stick can be used. A Bluetooth remote controller can also help operate the Record function without touching the phone – ideal for maintaining consistent measurements.
10. External Sensor Mode for Advanced Scanning
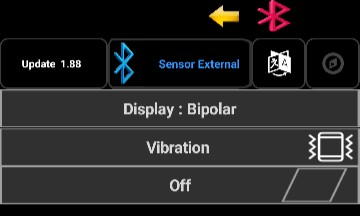
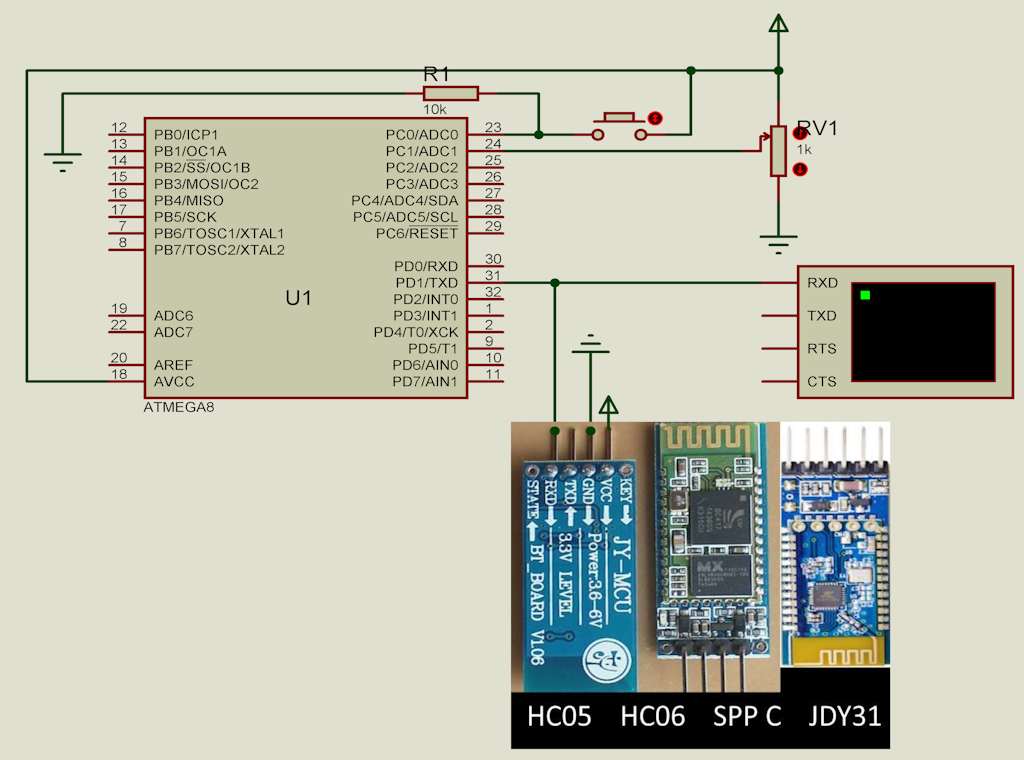
In External Sensor mode, activate the external option from the Settings page. Using a serial Bluetooth module such as HC-05 or another SPP-compatible device, a microcontroller can send measurement values to AnyScan209.
The communication range is based on values from 0 to 1024. In magnetometer mode, the center balance value is approximately 512. Other sensor types can use the full 0 to 1024 range for various measurements.
11. Internal Sensors – Four Powerful Modes in One App
AnyScan209 is not just a magnetometer. It is a universal 2D/3D visualizer that can read from four different internal smartphone sensors. To choose the sensor you want, simply long-press the sensor icon on the Settings page — a sensor selection list will appear, and you can switch between any of the following four sensors at any time.

- Open the Settings page.
- Long-press the sensor icon at the top of the settings panel.
- A list of all available internal sensors appears.
- Tap any sensor to activate it.
🧲 1. Magnetometer – For Geophysics, Cavity Detection & Magnetic Field Mapping
The magnetometer (compass sensor) is the most powerful mode in AnyScan209 and is designed for serious field work:
- Geophysical surveys – mapping subsurface anomalies
- Cavity and void detection – locating underground hollow spaces, tunnels, or buried structures
- Geological exploration – studying soil and rock magnetic signatures
- Magnetic field visualization – detecting and mapping static and alternating magnetic fields
- Metal and wire detection – finding ferromagnetic objects, rebar, pipes, and conduits behind walls
- Educational experiments – demonstrating electromagnetic principles in real time
This mode is ideal for researchers, geophysicists, treasure hunters, and anyone working with magnetic field analysis.
⛰️ 2. Barometer / Altimeter – For Elevation Mapping & Surface Topography
The barometric pressure sensor (available on many modern smartphones) measures atmospheric pressure and converts it into relative altitude. In AnyScan209 this sensor becomes a powerful elevation mapping tool:
- Altitude measurement – tracking elevation changes
- Surface topography mapping – building 2D and 3D maps of terrain height differences
- Floor-level surveys – detecting small height variations across an area
- Outdoor field surveys – mapping hills, slopes, and elevation contours
💡 3. Light Sensor – For Illumination Mapping & Environmental Light Analysis
The ambient light sensor measures the intensity of light around the phone. In AnyScan209, this sensor becomes a professional illumination mapping tool:
- Light intensity surveying – measuring and mapping brightness across a surface or space
- Lighting installation analysis – visualizing how light is distributed in a room, hall, or outdoor space
- Environmental light visualization – analyzing natural and artificial light patterns
- Greenhouse & agricultural mapping – mapping light distribution for optimal plant growth
- Photography & studio lighting – checking evenness of illumination
- Architectural lighting design – verifying light coverage and uniformity
Perfect for lighting engineers, greenhouse operators, photographers, and anyone who needs to see how light is distributed in a space.
🔊 4. Sound / Noise Meter – For Acoustic Mapping & Industrial Noise Analysis
The phone's microphone is used as a professional sound level meter (SPL meter). In AnyScan209 this becomes a powerful acoustic mapping tool:
- Noise mapping – measuring and visualizing sound levels across an area
- Industrial noise analysis – mapping noise pollution in factories, workshops, and construction sites
- Acoustic environment surveying – analyzing sound distribution in rooms, halls, and open spaces
- Soundproofing verification – checking effectiveness of acoustic insulation
- Machine diagnostics – locating abnormal noise sources in equipment
- Environmental acoustics – studying urban, rural, and indoor noise patterns
Ideal for acoustic engineers, safety inspectors, industrial technicians, and researchers studying noise pollution.
With AnyScan209, the same app can be used as a magnetometer, altimeter, light meter, or sound level meter — just switch the sensor and start scanning. All four sensors use the same 0–1024 visualization range, the same 2D/3D viewers, and the same OBJ / STL / CSV export. This makes AnyScan209 a truly universal measurement platform for professionals and hobbyists alike.
12. Gain and Balance – Understanding the 0–1024 Range
Internal Sensor (Magnetometer)
Smartphone magnetometers are typically 16‑bit sensors with a raw range of 0 to 65,535. AnyScan209 applies a Gain factor (adjustable from 10 down to 1) to map this raw data into the 0–1024 visualization range.
- Default Gain = 10: The app automatically balances the sensor using the Balancer (⚖️) icon, setting the neutral point to 512. This provides maximum sensitivity for magnetic field detection.
- Lower Gain (9 to 1): Reduces sensitivity but covers a wider measurement range. At Gain = 1, every 64 raw sensor units equals 1 unit in the 0–1024 range.
External Sensor (Bluetooth)
In External mode, the user is responsible for pre‑scaling their sensor data in hardware or firmware before sending it via Bluetooth. The app expects values in the 0–1024 range and applies no additional gain or scaling internally.
Serial.println().
13. Schematic Diagram – External Sensor Connection
14. Microcontroller Integration: BASCOM to Arduino
Original BASCOM Code
                $regfile = "m8adef.dat"
                $crystal = 8000000
                Config Adc = Single , Prescaler = Auto , Reference = Avcc
                Enable Interrupts
                Config Portc.0 = Input
                Config Portc.2 = Output
                Dim Insw As Bit
                Dim Vale As Word
                Do
                If Pinc.0 = 0 And Insw = 1 Then
                Insw = 0
                Portc.2 = 0
                End If
                If Pinc.0 = 1 And Insw = 0 Then
                Portc.2 = 1
                Insw = 1
                Vale = Getadc(1)
                Print Vale
                End If
                Loop
Converted Arduino C++ Code
                // BASCOM PortC.0 → Arduino input pin
                const int switchPin = A1;
                const int outputPin = 2;
                bool lastSwitchState = false;
                int analogValue = 0;
                void setup() {
                Serial.begin(9600);
                pinMode(outputPin, OUTPUT);
                pinMode(switchPin, INPUT);
                digitalWrite(outputPin, LOW);
                }
                void loop() {
                bool currentSwitchState = digitalRead(switchPin);
                if (currentSwitchState == LOW && lastSwitchState == HIGH) {
                lastSwitchState = LOW;
                digitalWrite(outputPin, LOW);
                }
                if (currentSwitchState == HIGH && lastSwitchState == LOW) {
                digitalWrite(outputPin, HIGH);
                lastSwitchState = HIGH;
                analogValue = analogRead(A1);
                Serial.println(analogValue);
                }
                }
Alternative Version with Pull-up Enabled
                // Arduino code with INPUT_PULLUP enabled
                const int switchPin = A1;
                const int outputPin = 2;
                bool lastSwitchState = false;
                int analogValue = 0;
                void setup() {
                Serial.begin(9600);
                pinMode(outputPin, OUTPUT);
                pinMode(switchPin, INPUT_PULLUP);
                digitalWrite(outputPin, LOW);
                }
                void loop() {
                bool currentSwitchState = digitalRead(switchPin);
                if (currentSwitchState == LOW && lastSwitchState == HIGH) {
                lastSwitchState = LOW;
                digitalWrite(outputPin, LOW);
                }
                if (currentSwitchState == HIGH && lastSwitchState == LOW) {
                digitalWrite(outputPin, HIGH);
                lastSwitchState = HIGH;
                analogValue = analogRead(A1);
                Serial.println(analogValue);
                }
                }
Proteus File Download
15. Magnetometer Sensor Guide for AnyScan209
This table provides information about smartphone magnetometer sensors and their general characteristics for use with AnyScan209.
| Manufacturer | Sensor Model | Sampling Rate | Resolution | Noise Level | Example Devices |
|---|---|---|---|---|---|
| MEMSIC | MMC5616WA | 1000 Hz | 0.00625 µT/LSB | Very Low | Check device specifications |
| AKM | AK09973D | Up to 2000 Hz | High sensitivity | Medium | Selected Samsung, Xiaomi and Sony devices |
| Yamaha | YAS537 | 200 Hz | 0.15 µT/LSB | Very Low | Samsung Galaxy S6, S7, Note series |
| Yamaha | YAS539 | ~200 Hz | 0.12 µT/LSB | Very Low | Samsung Galaxy A series devices |
| Alps Alpine | HSCDTD015A | 200 Hz | 0.075 µT/LSB | Low | Used in some modern smartphones |
| STMicroelectronics | LIS3MDL | 1000 Hz | Medium | Medium | Motorola, Nokia and LG devices |
⚠️ Why does my flagship phone have a weaker or slower magnetometer sensor?
Most flagship smartphones use high-quality 16-bit magnetometer sensors with excellent precision and fast sampling rates. However, you may notice that a mid-range or budget device (e.g., Samsung Galaxy A-series) performs more sensitively or responds faster in certain conditions.
The reason is not the sensor chip itself, but its physical installation environment:
- Wireless charging coils – Many flagship phones include built-in magnets or metal rings for wireless charging alignment. These permanent magnets create a constant magnetic offset that can interfere with the magnetometer.
- Metal bodies and frames – Premium devices often use metallic back covers or chassis. Ferromagnetic materials can distort the surrounding magnetic field and affect sensor readings.
- Sensor placement – In some budget-friendly phones (like Samsung A-series), the magnetometer is mounted farther away from magnetic interference sources and housed in a plastic body, resulting in a cleaner, more responsive signal.
Bottom line: The sensor itself is rarely the problem. Installation conditions, nearby magnets (from wireless charging), and metallic components play a much larger role in real-world performance. Always test your device in a magnetically clean environment for the best results.
Tip: To view information about your phone's magnetometer sensor, open Settings, go to the Update section, and select Sensor internal : help.
16. Use Your Smartphone as a Magnetic Field Detector
How to Use the Gauge and Graph Features
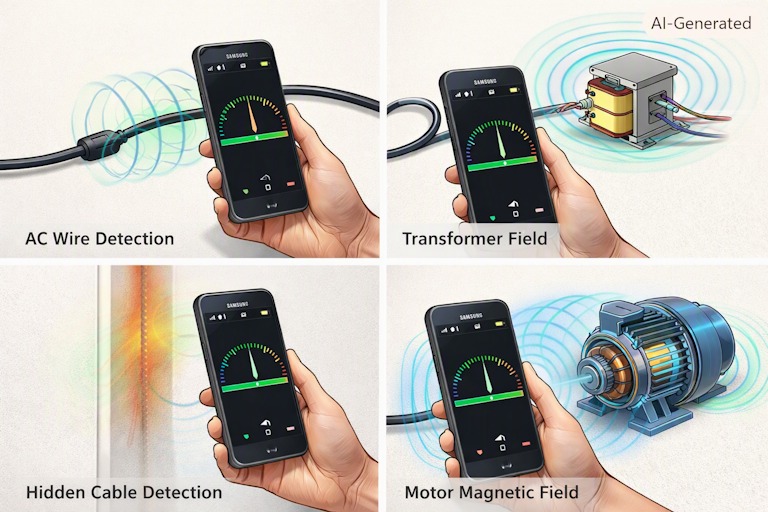
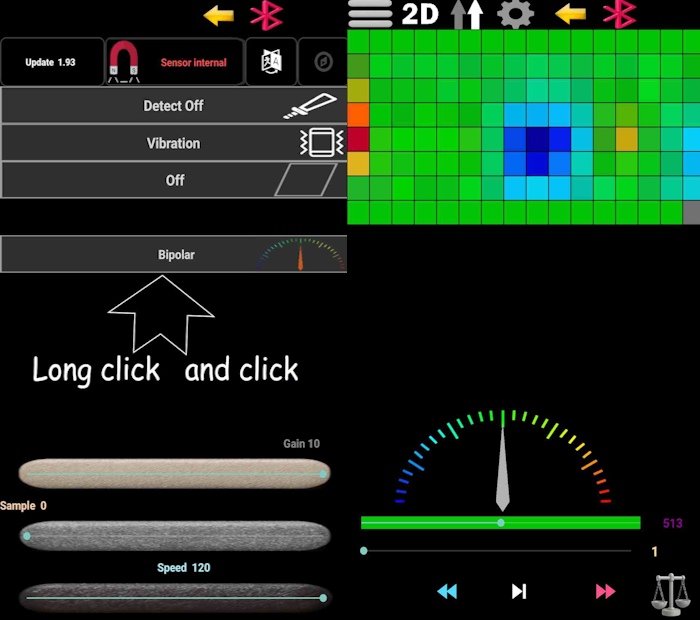
In AnyScan209, switch to Internal Sensor mode. Press and hold the sensor option to open advanced settings, then enable the Graph and Gauge features. Select the Bipolar Gauge display mode for real-time magnetic field visualization.
Return to the scan screen and bring your smartphone close to a device that produces a magnetic field, such as:
- Current-carrying wires
- Transformers
- Relays
- Solenoids
The gauge will respond to changes in the surrounding magnetic field. Alternating magnetic fields from AC electrical systems can cause the indicator to move in both directions, allowing visualization of magnetic field changes. DC magnetic fields may cause the indicator to move in one direction depending on the field orientation.
Educational and Practical Applications
- Educational experiments – demonstrate magnetic field principles
- Magnetic field visualization – observe field patterns in real-time
- Locating areas with stronger magnetic interference – identify sources of electromagnetic noise
Note: To locate wiring paths behind the wall, you need a good excitation field. It is recommended to have a high-power load—such as an electric heater or an electric kettle—at the end of the circuit so that a suitable inductive field is generated around the wires.
17. Practical Tips for Detecting Wires and Conduits Behind Walls
The method described above works best for cables or wires inside PVC or non-metallic conduits at shallow depths (a few centimeters). Since the magnetic field from AC current can penetrate plastic pipes, your phone's magnetometer can detect the alternating field and help trace the wiring path.
For metal conduits (steel or galvanized):
You do not need any current flowing through the wires inside the pipe. Even with no load at the end and no current passing through, the metal conduit itself creates a detectable magnetic anomaly. Because steel and galvanized pipes are ferromagnetic materials, they disturb the magnetic field around them. When you move your phone over a metal conduit, the magnetometer needle will deflect to one side (a static offset) simply due to the pipe's own magnetic signature.
- PVC / non‑metallic pipes: Require a high‑power load (heater, kettle) to generate a strong AC magnetic field.
- Metal (steel/galvanized) pipes: Detectable even with no current – the pipe itself creates a magnetic disturbance.
- Detection depth is limited to a few centimeters for most smartphone magnetometers.
Please note that Android devices use different magnetometer sensors. The performance of magnetic field measurements depends on the quality and specifications of the sensor installed in each phone.
18. Frequently Asked Questions About AnyScan209
Is AnyScan209 completely free to download and use?
Yes, AnyScan209 is 100% free to download and use. There are no hidden charges, in-app purchases, or premium versions. The app provides full functionality without any cost.
Does AnyScan209 work with external sensors?
Yes! AnyScan209 supports external Bluetooth sensors such as HC-05 modules and other SPP-compatible devices. This makes it ideal for custom measurements using specialized hardware.
What data formats can I export from AnyScan209?
AnyScan209 supports export in three formats: OBJ for 3D models, STL for 3D printing applications, and CSV for data analysis in spreadsheets and scientific software.
Can I use AnyScan209 for more than just magnetic field scanning?
Absolutely! AnyScan209 is a universal 2D/3D visualizer with four internal sensors (magnetometer, barometer, light, sound) and support for any external 0–1024 sensor data. Whether you're measuring temperature, pressure, altitude, light, acoustic signals, or custom sensor data, just send values between 0 and 1024 and the app creates stunning visualizations.
Does AnyScan209 contain ads or collect my data?
No. AnyScan209 is completely free, contains no advertisements, and never sends any data to external servers. All scans, settings, and data stay locally on your device. Your privacy is fully respected.
Which Android devices are compatible with AnyScan209?
AnyScan209 works on any Android device that has a built-in magnetometer sensor. Most modern smartphones include this sensor. For best results, use devices with high-quality sensors like those listed in the sensor guide above.
Can I use AnyScan209 for professional geophysical surveys?
Absolutely! AnyScan209 is designed for both educational and professional use. Its 2D/3D visualization, data export, and external sensor support make it suitable for various fields.
What is the Gain feature and how does it work?
Gain adjusts the sensitivity of the internal 16-bit magnetometer (0–65535 raw). Default Gain=10 maps the raw data to the 0–1024 visualization range with neutral point at 512. Lower Gain (9 to 1) reduces sensitivity but covers a wider range. In External mode, you must pre-scale your sensor data before sending via Bluetooth.